Part 2: Configuring Your Analytics Camera
Filed under: IP Cameras, Analytics
In Part 1 of this blog, we learned how to easily setup and calibrate our MegaPX Indoor Analytics Dome by following a few simple steps in the camera’s software.
In Part 2, we’ll cover how to configure your analytics. This is the last step in your camera’s setup. Like calibration, configuration is easy and can also be completed in just minutes.
As discussed previously, the analytic you choose determines your camera mount location and configuration method. There are currently three analytics to choose from with our MegaPX Indoor Analytics Dome: people counting, queue length monitoring and customer dwell time.
Let’s take a closer look at configuring each analytic. To start, login to the camera and select Analytics Setup in the top left hand corner of your screen. Create a new event by clicking on the plus sign above the menu, then choose your analytic.
1. People Counting
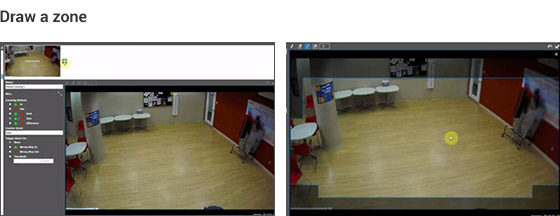
I) To configure people counting, start by drawing a zone. The zone is a box in your field of view (FOV) that helps the camera know exactly where to detect people counts. The zone ensures the most accuracy by masking out areas where analytics won’t be calculated (the grey area outside your zone). The clear area inside the zone is where people will be detected.
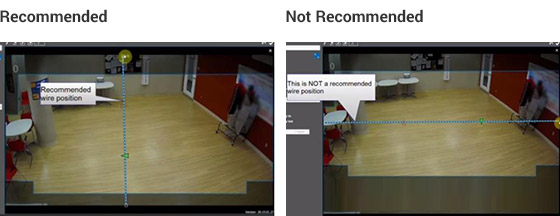
II) Use the software to draw a trip wire, or line, in the center of your image. This is where the count will register. I recommend drawing the line vertically through the center of your screen, so people are moving horizontally (from left to right or vice versa) across the line.
III) Customize the analytic by choosing directional counts (for example, counting people entering or exiting or both). You can also select when the counter will reset (daily, hourly, etc.) and set up an alarm to alert you when your count has reached your set threshold.
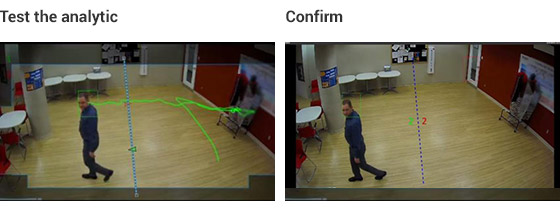
Test the analytic by having someone walk through your FOV. A green or red line will follow the person (the color depends upon the direction they are walking). The line will change color to indicate that the analytic is working.
Once you’ve saved your preferred settings, close the setup mode. If you’ve configured the analytic correctly, you should see your line in the middle of the screen and the numbers on each side of the line indicating the count for each direction you’ve set. Watch the training video to learn more.
2. Queue Length Monitoring
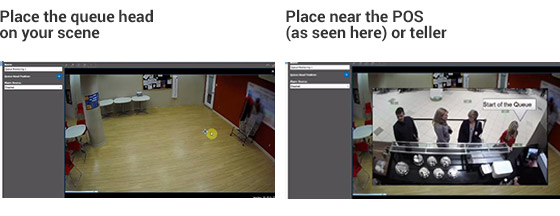
I) To configure the queue length monitoring analytic, use your mouse to select the queue head position from the menu and place it onto your FOV. Place the queue head exactly where the front of your queue will be. In a retail environment, the queue head would be the point-of-sale (POS). In a banking environment, it would be the bank teller.
II) Draw a zone to narrow the area in your FOV where you want to capture the queue data. Again, this process helps the camera know exactly where to look when processing the analytic. As mentioned in Part 1 of this blog, make sure your queue extends horizontally through the FOV to achieve the best accuracy.
III) Customize the analytic by setting up alarms. You can trigger an alarm for a long wait time, or when the queue exceeds a certain length or doesn’t reach a certain length. To do this, select Big Queue Length from the menu and move the slider tool to your preferred queue length.
Once you’ve set your alarms, save your settings. Test the analytic by having someone walk through your scene and stand at the head of the queue. If you’ve configured the analytic correctly, you should see a box indicating how many people are in the queue, as well as a box over each person’s head, showing how long they’ve been in the line. Watch the training video for more details.
3. Customer Dwell Time
I) Give your dwell time analytic a name if desired, and set your trigger threshold. This is the length of time after which you will receive a notification.
II) Draw a zone to give the camera the exact area of interest for dwell time, then save your settings.
III) Test your analytic by having someone walk into your FOV. If you’ve configured the analytic correctly, a box should appear above the person’s head, indicating the amount of time they’ve been in the area of interest. The box should turn red at the threshold you’ve set (for example, after 15 seconds).
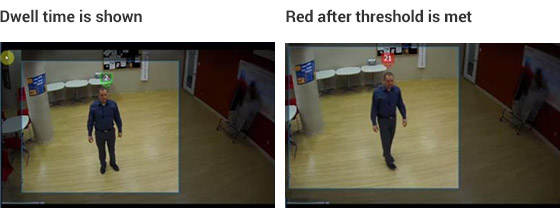
Watch the training video for more.
Once you’ve configured your analytic and saved your settings, you may want to continue testing and adjust your sensitivity depending on the results. It’s easy to increase or decrease the sensitivity based on your needs.
Got questions or have something to add? Give us your feedback below.